The single source of truth for well construction data.
AURA Data Hub unifies real-time drilling, completions, and financial data from an operator's
daily reporting, real-time analytics, historical archive, master data, and AFE systems into one
PostgreSQL schema, exposed through a 95+ endpoint REST API — so BI
tools, engineers, and integrations query one platform instead of reconciling five.
379+
configured data types in a single flexible-storage table
95+
REST endpoints across 6 functional domains
280M+
records under management across five sources
22yrs
of operations history — 10.7M Well Operations Archive records alone
99.9%
uptime SLA in production
*Figures as of 2026-07-15, from a live production deployment at a major energy operator. Record counts from aura_data: Analytics 257.6M (incl. WITS telemetry), Well Operations Archive 10.7M active (22 years of operations), Operations Reporting System 3.9M, AFE Design 0.5M, plus 11.7M derived — of which ~3M business-active rows drive daily BI. See Chapter 04 for the storage model behind these numbers.
02 — Functionality
What AURA gives every kind of user
One platform, multiple front doors — a portal for day-to-day users, an admin console for
platform operators, automated data-quality monitoring that runs without anyone watching, and
a notification layer that reaches ops before they have to ask.
Portal
The day-to-day front door for engineers and operations — six sections, Azure SSO gated.
● Dashboard — KPIs & summary stats
● Explorer — drill-down by well, date, phase
● Reports — export to Excel / CSV / Parquet
● Operations Reporting System Refresh, Data Quality, What's New
Liveaura_user_ui
Admin + Data Editor
Platform operator console — who can see what, and the master data everyone else depends on.
● User & Role Management — ReadOnly / DataManager / Developer / System
● Permissions — field-level access control, down to a single locked column
● Audit Logs — who queried what, when, how many rows
● Health status emails — backup health, import lag, lock contention
Livenotifications.roderickc.com
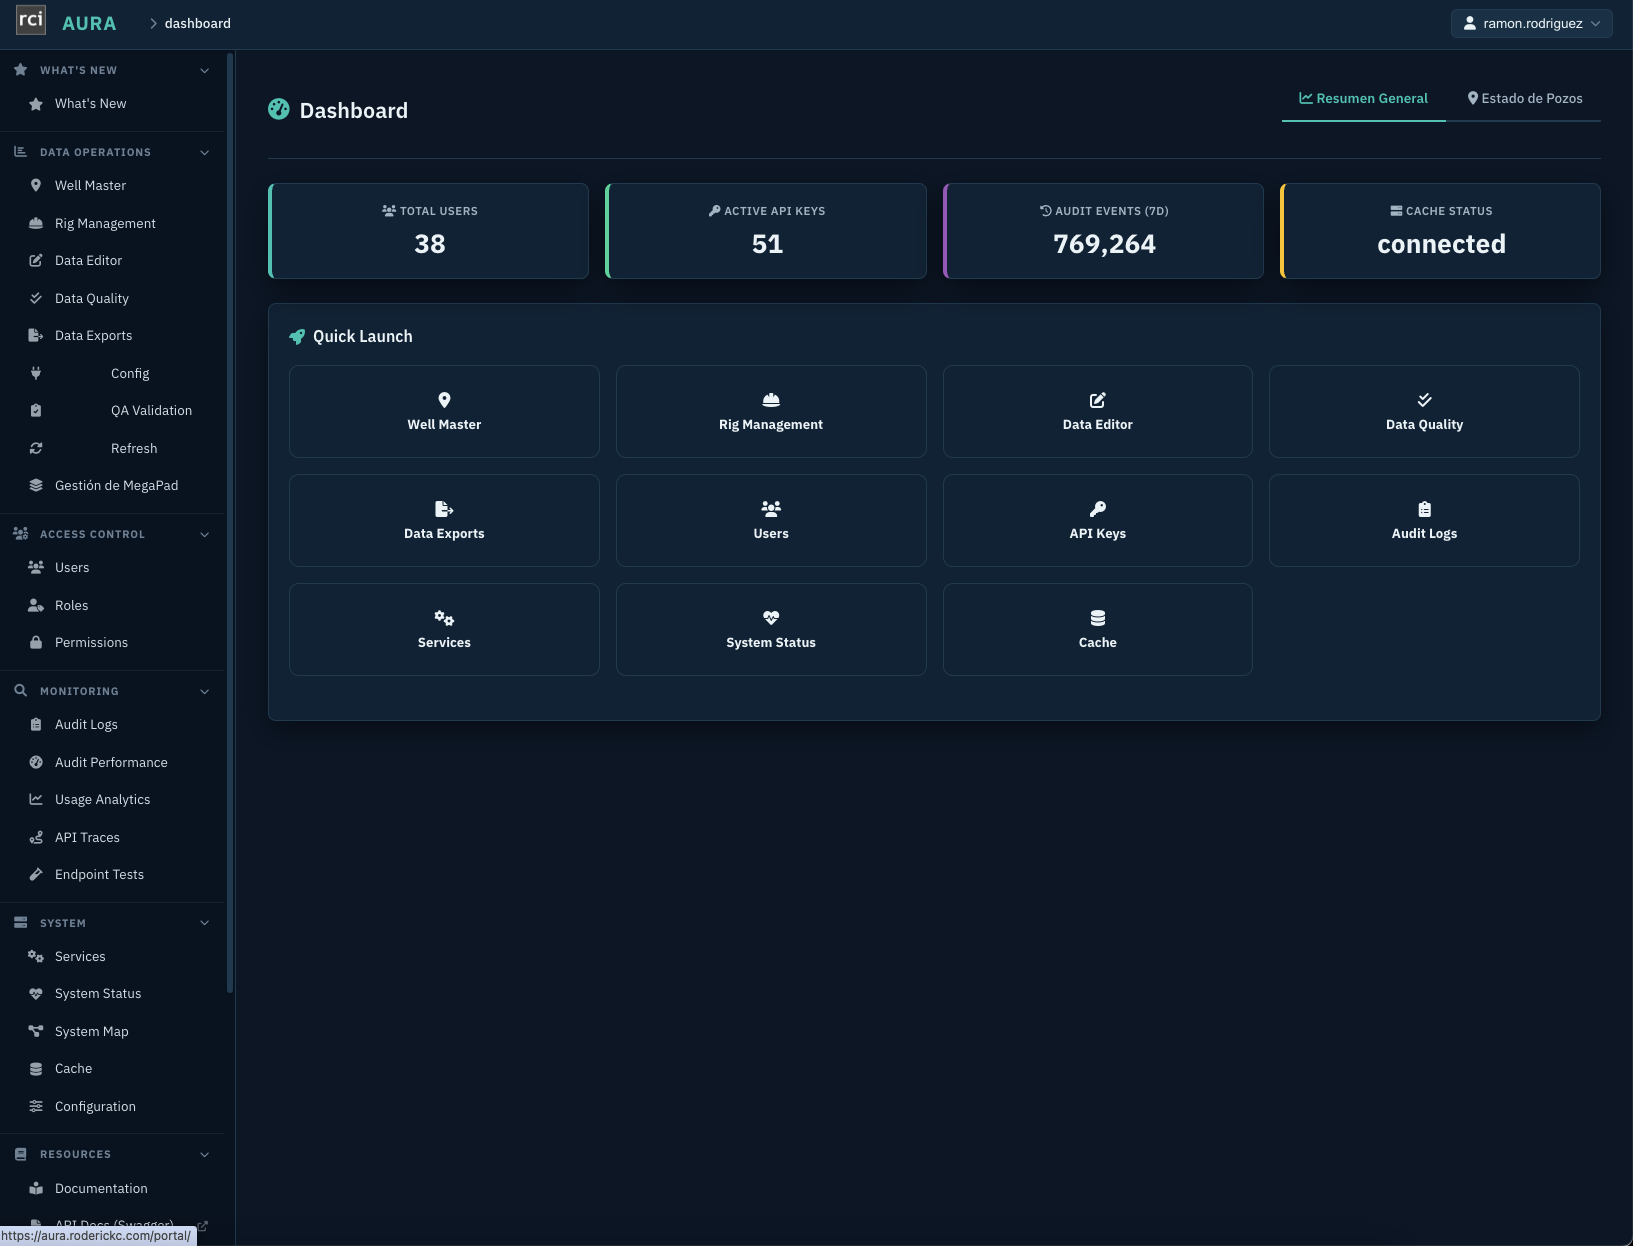
The Admin portal front door: live KPIs (38 users, 51 active API keys, 769K audit events/7d) and the full operations taxonomy — data operations, access control, monitoring, and system management in one place.
Access control isn't just role-gated pages — it goes down to the individual field,
with locked-field enforcement covered in Chapter 09 — Data
Governance.
95+
endpoint modules across 6 functional domains
34
public reporting / completions / AFE / drilling endpoints
30+
admin endpoints — users, roles, audit, master data
Auth: Azure SSO (Microsoft Entra) for operator and RCI staff —
corporate accounts sign in via OIDC, roles gate section visibility across both the Portal and
Admin Portal.
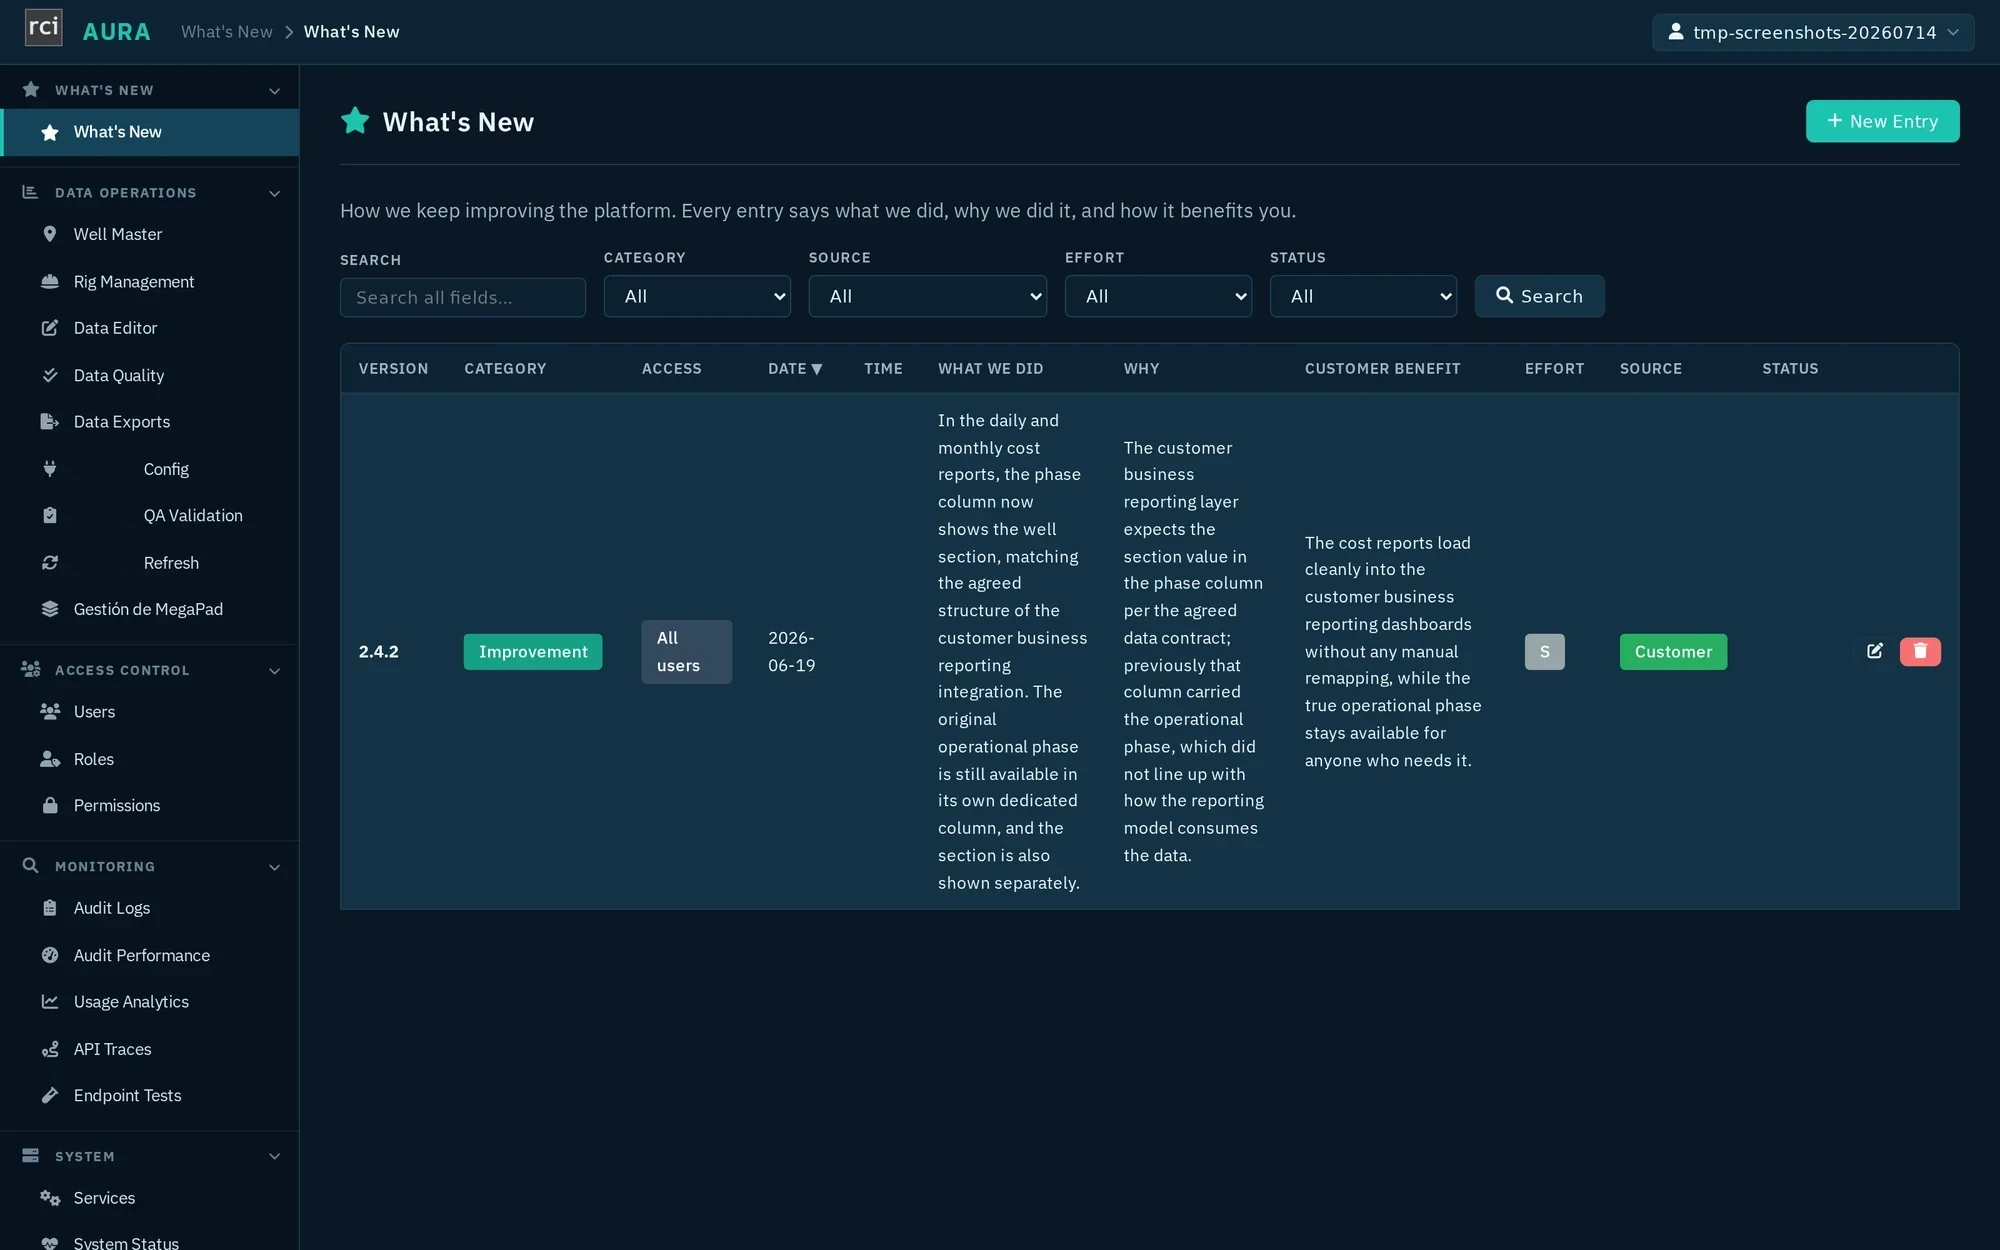
What's New — the product-evolution log. Every shipped change is recorded with its customer-facing benefit, not just a commit message.
03 — Architecture
Where the data lives, and what moves it.
AURA is a small set of services around one PostgreSQL database — a public API, an
admin API, an import engine, and a cache — behind a single gateway. The interesting
part is the edge, where agents inside the customer network let AURA reach systems it can't
directly see.
The runtime, in one picture
One entry point, a handful of services, and one database that everything reads from and
writes to — the same aura_data table the next chapter unpacks in full.
The architecturally interesting part isn't the database — it's the edge. AURA never
bridges into the operator's network. Instead, a lightweight agent runs inside the customer's
VDI (on the operator's VDI), pulls what AURA needs from systems like Well Data Master's Oracle
database, and pushes results back out. AURA initiates nothing behind that boundary; the
agent always calls out, never the other way around.
AURA ↔ VDI agent — pull-then-push, never a bridge in
And the platform documents itself
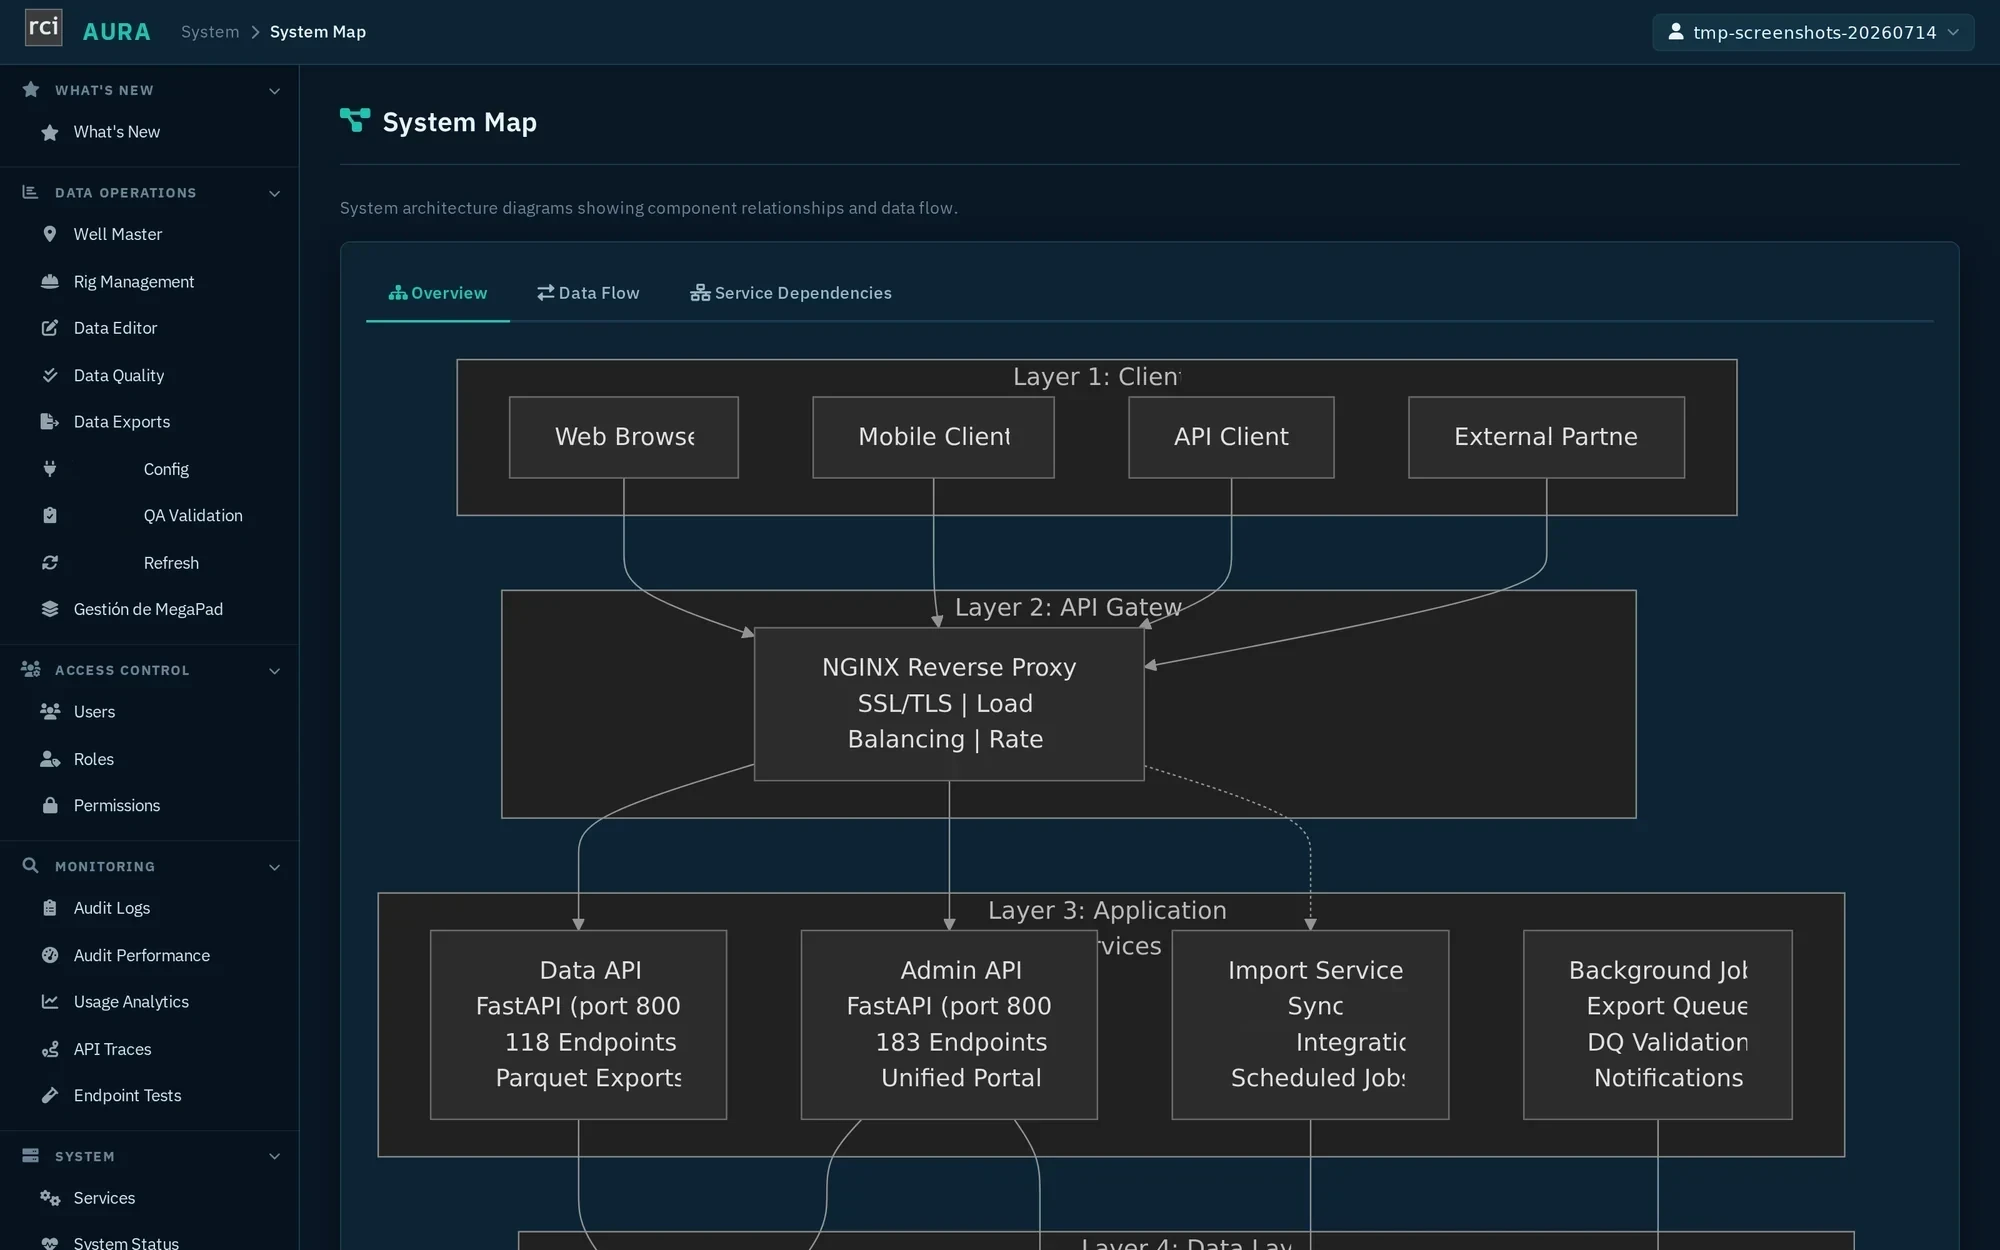
The diagram above isn't a slide someone drew once and forgot — AURA's own admin
console generates the same picture live, straight from its running services.
The same architecture, drawn by the platform itself. This isn't a slide — it's a live view generated by AURA's own admin console, proof the picture above matches what's actually running.
*Architecture facts from the platform's runtime topology documentation (services, ports, PostgreSQL partitioning, Redis, systemd, NGINX routing) and the VDI outbound-only pull-push agent model. Screenshot: AURA Admin System Map, captured 2026-07-14.
04 — Flexible Storage
Add a new data source with zero code and zero migration.
AURA's core architectural bet: one physical table, one JSONB column, config-driven ingestion.
A brand-new Operations Reporting System vista can be live and serving BI reports in under an hour, because there
is no Python to write and no schema to migrate — only JSON to edit.
Sources → the aura_data table → consumers
aura_data storage architecture — three bands
Config, not code — the 5-step workflow
Adding a new Operations Reporting System vista (example: miestacion) never touches Python. Edit JSON,
pre-create the partition, deploy the config, trigger an import — the data is live the same minute.
1 Edit config JSON
→
2 Pre-create partition
→
3 Deploy config
→
4 Trigger import
→
5 Live via /data/{data_type}
No migration, no restart, no code review cycle. The data lands in
aura_data(data_type='miestacion') and is queryable the same minute —
automatically, through the generic endpoint, before anyone writes a single line of
domain-specific code.
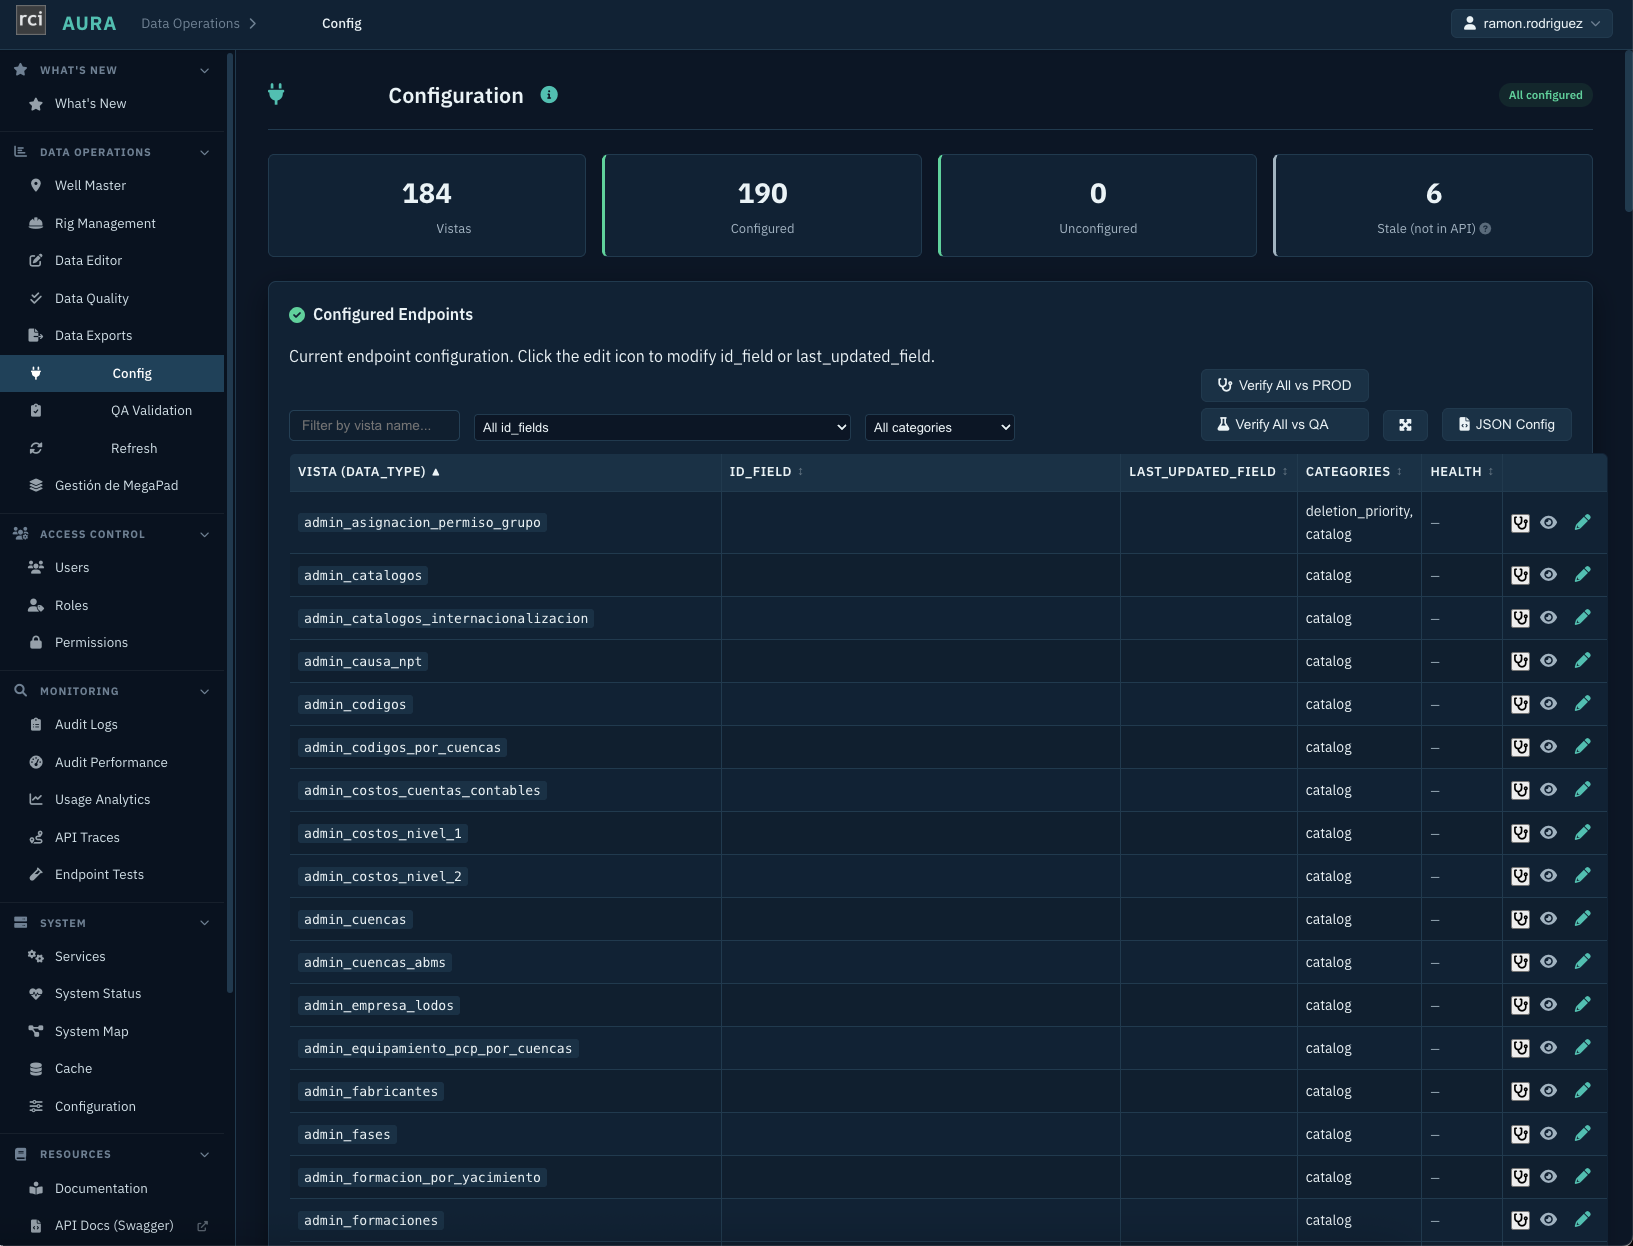
184 vistas, 190 configured, 0 unconfigured, 6 stale. The config JSON from step 1 isn't a toy example — this is the live registry it belongs to, one row per data source, each mapped to its identity and freshness fields. The registry isn't just configuration — it continuously knows whether each source is healthy and in sync across environments, one click from a PROD/QA verification and the raw JSON.
The wow moment
A new Operations Reporting System vista live and serving BI reports — zero code changes, zero schema migration.
<1 hour
Five patterns that make this work
Identity
__aura_external_id
A stable, deterministic business key set on every record, built from source fields — enables BI delta-merge without re-querying the database.
JSON mapping files normalize Operations Reporting System's Spanish field names to BI-friendly English, and switch between business and raw shapes per request.
cuenta → account_code | ?field_template=BI|raw
Units
Imperial → metric
Analytics delivers imperial units (feet, bbl/min); Operations Reporting System is metric-native. AURA normalizes everything to metric at the field level, so BI always sees one consistent unit system.
depth: ft (Analytics source) → m (API response)
Time
Timezone handling
Source timestamps arrive in Argentina time (ART); AURA normalizes to UTC in storage, and reporting uses a configurable 6 AM cutoff so a “day” matches the rig’s operational day — sync windows and Well Data Master write-backs are scheduled and formatted in ART (es-AR).
ART → UTC (store) | 6AM cutoff → operational day
History
The Ledger
Rows are never overwritten or physically deleted. A new version supersedes the old one (status: active → superseded/deleted), and both the source system's timestamp and AURA's own storage timestamp are preserved — so any query can be replayed “as of” a moment, and any discrepancy audited.
status: active | superseded | deleted · last_updated + internal_last_updated
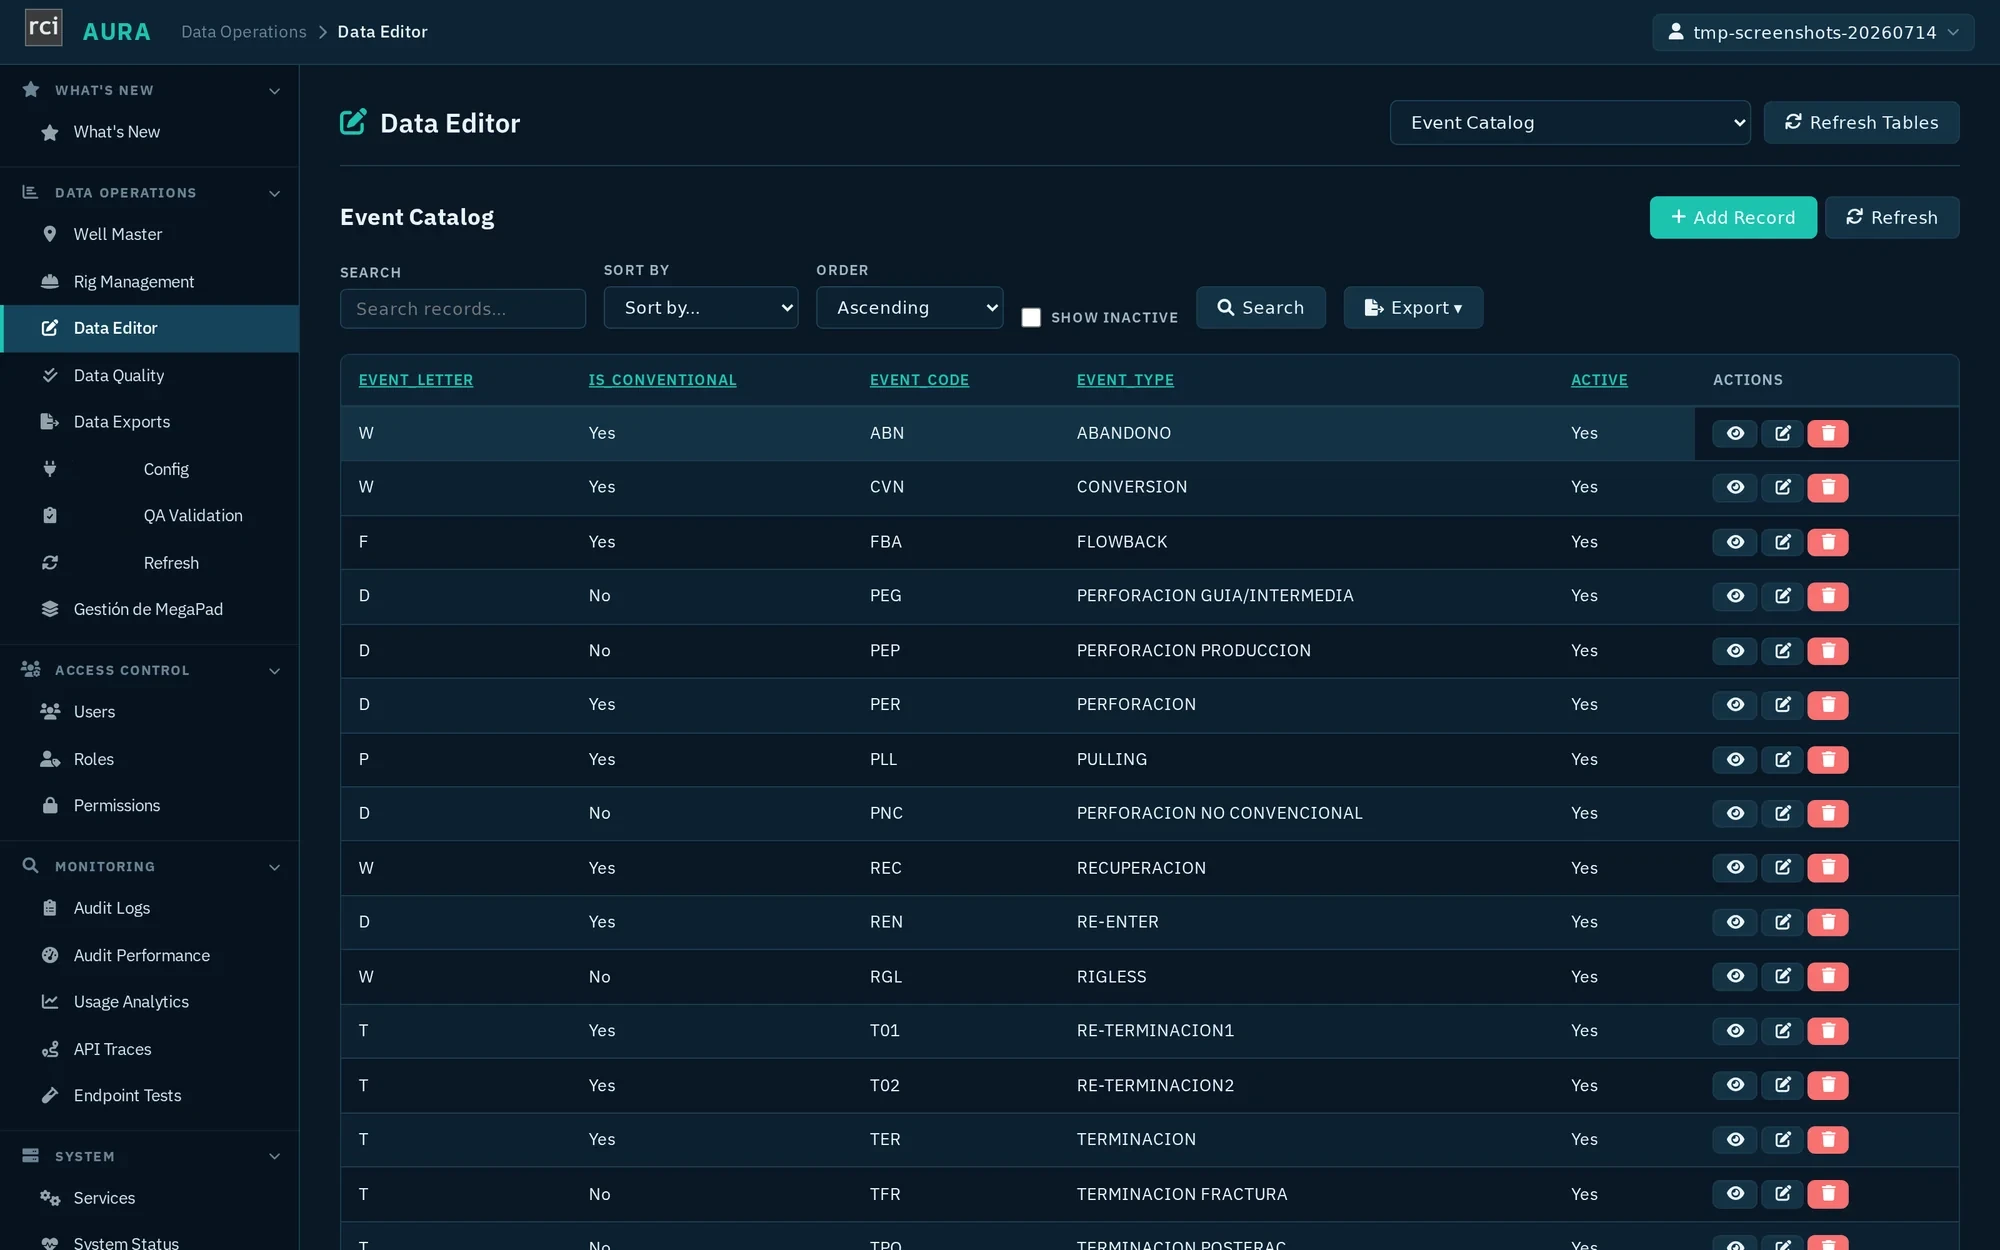
Every stored table, one editor. The flexible-storage model isn't just for ingestion — the same generic Data Editor lets an operator view, search, and correct any configured table without a bespoke admin screen per data type.
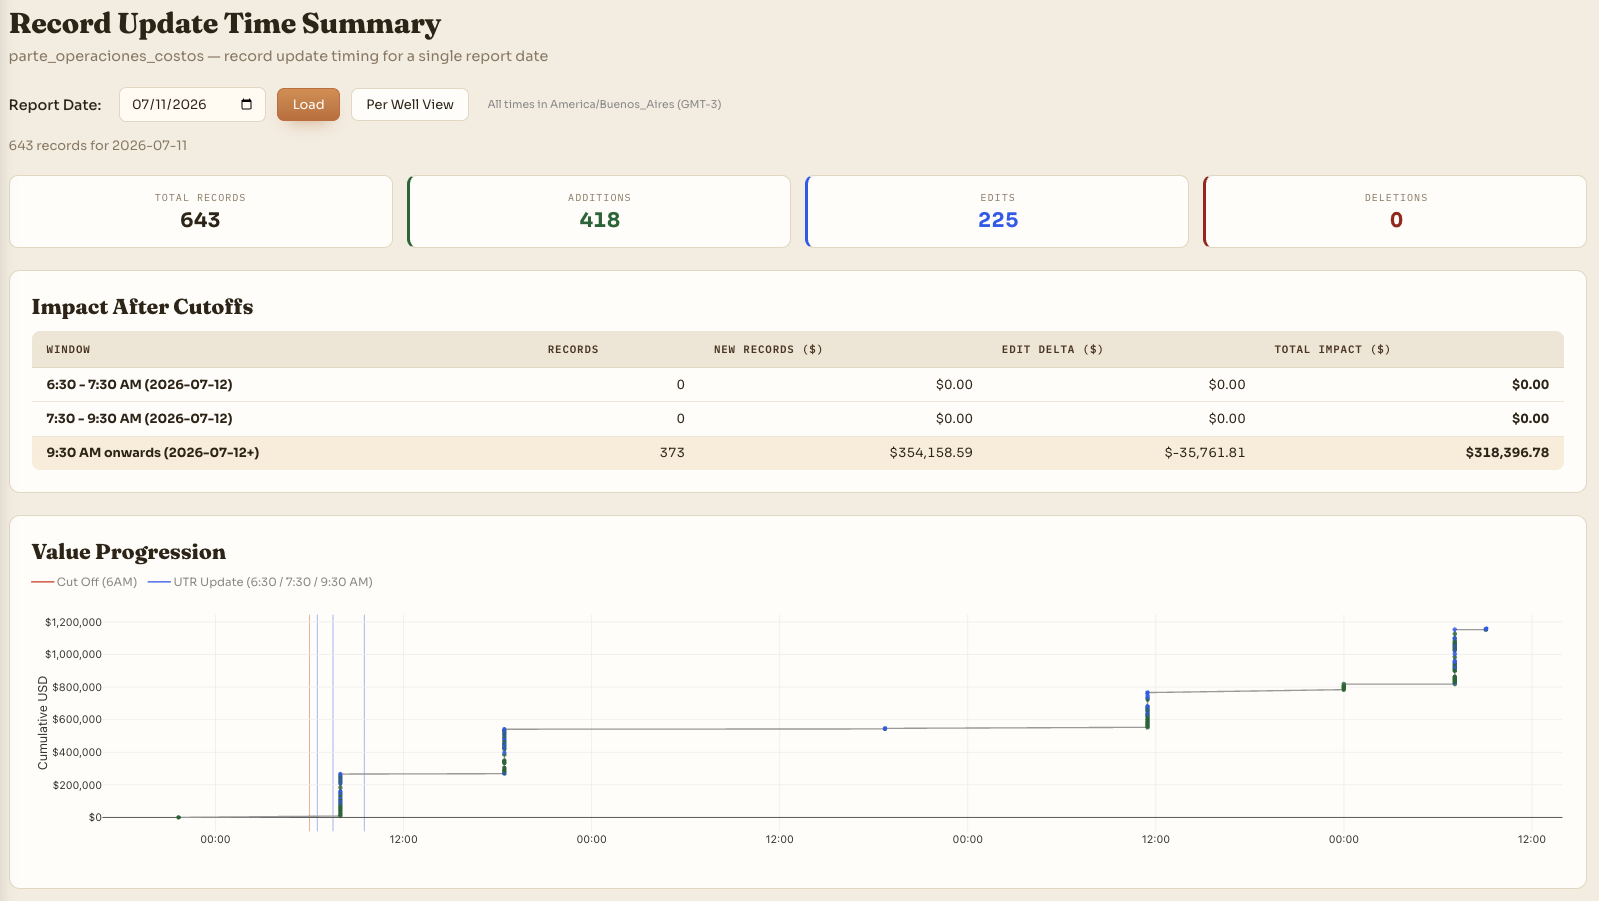
The Ledger in action — auditing time & money
When a BI number looks wrong at 7 AM, the ledger shows precisely which records
hadn't arrived yet, when they did, and what they changed — because every record
keeps its full timing history, not just its latest value.
643 records, timestamped both ways. This audit exists only because every record carries its full history: 418 additions and 225 edits to parte_operaciones_costos on one report date, checked against the 6 AM cutoff and the 6:30 / 7:30 / 9:30 BI windows — records arriving after the last window are flagged, with $318,396.78 in cost impact identified as landing “9:30 AM onwards.”
05 — Automation Core
One trigger. Many systems.
AURA is becoming the automation core of the operator's well-construction stack: an event in one
system — an AFE created, a scheduled sync tick, a field update landing in Operations Reporting System —
automatically configures, populates, or refreshes the others. No one re-types the same well into
three different screens.
When the operator creates a new AFE, AURA fans that single event out to the Corporate ESB, Operations Reporting System,
completions staging, notifications, and BI — work that used to mean manual entry into 3+
systems now happens in the background within 15–60 minutes.
Overview — one trigger, three parallel branches
Each branch, in detail
1 · FARO notify
FARO sends both an email and an SMS to the operations distribution list the moment AURA responds — no dashboard-watching required.
2 · the Corporate ESB → Operations Reporting System
Operations Reporting System's async chain is fire-and-forget from AURA's point of view — Operations Reporting System ACKs the operator by email, not back to AURA. Any sync failure alerts immediately.
3 · Completions auto-load → BI
Only fires when the AFE carries stage design data; otherwise this branch is a no-op. Completions dashboards pick up the new well on the next refresh.
Before: manual entry into 3+ systems
Someone re-types AFE sections into the Corporate ESB by hand
Someone re-keys the well into Operations Reporting System's programa & tareas
Completions stages are copied in separately from the design feed
Every hand-off is a chance to mistype a section name or a depth
After: one AFE create. AURA's cascade replaces the manual entry with a single
trigger — three systems configured in parallel, no re-typing, no missed hand-off. Hours
to days saved per well.
B · Well Data Master read → create well (D1)
Five times a day, a VDI agent reads the operator's Well Data Master Oracle master and syncs it into AURA —
keeping field, area, and well-status attribution current on all 6,575 active wells without anyone
running a manual export.
Well Data Master Oracle → AURA well master
6,575
active wells synced per cycle
33
attributes mapped — 23 direct + 10 catalog FK-resolved
5×/day
business-hour cron: 6:27, 7:27, 9:27, 11:27, 12:27 ART
38s
execution time per full sync (Oracle read + AURA ingest)
Well Data Master remains authoritative — AURA only observes for D1, with a strict 1:1
POZO_ID↔UWI match and zero inactivations.
C · Update Well Data Master operation dates (D2 write-back)
Chained right after the D1 read on the same cron tick, AURA writes field-sourced dates and survey
depths back into Well Data Master — guarded by an idempotency ledger and a no-downgrade rule so a stale
or shallower survey can never overwrite a better existing value.
Operations Reporting System reales → ledger guard → Well Data Master — ledger-guarded
Attribute
Field
Source
327
Inicio Perforación (spud date)
Operations Reporting System-first COALESCE
329 / 330
Inicio / Fin Terminación
Operations Reporting System-first COALESCE
331 / 332
TVD / TMD (survey depths)
Deepest active survey station, 2dp round
A reversible production test validated the write path end-to-end — including catching
and fixing a comma-decimal formatting edge case (a "3065.01" input corrupting to 306501)
before any live write.
D · Well File System push for Daily Events Viewer
Every 15 minutes, a VDI agent pulls pending wells, events, and operations from AURA and pushes
them into the Well File System — feeding the Daily Events Viewer, the daily drilling dashboard
that consolidates reports, activities, and contractor performance.
AURA pending payload → VDI poll → Well File System → Daily Events Viewer
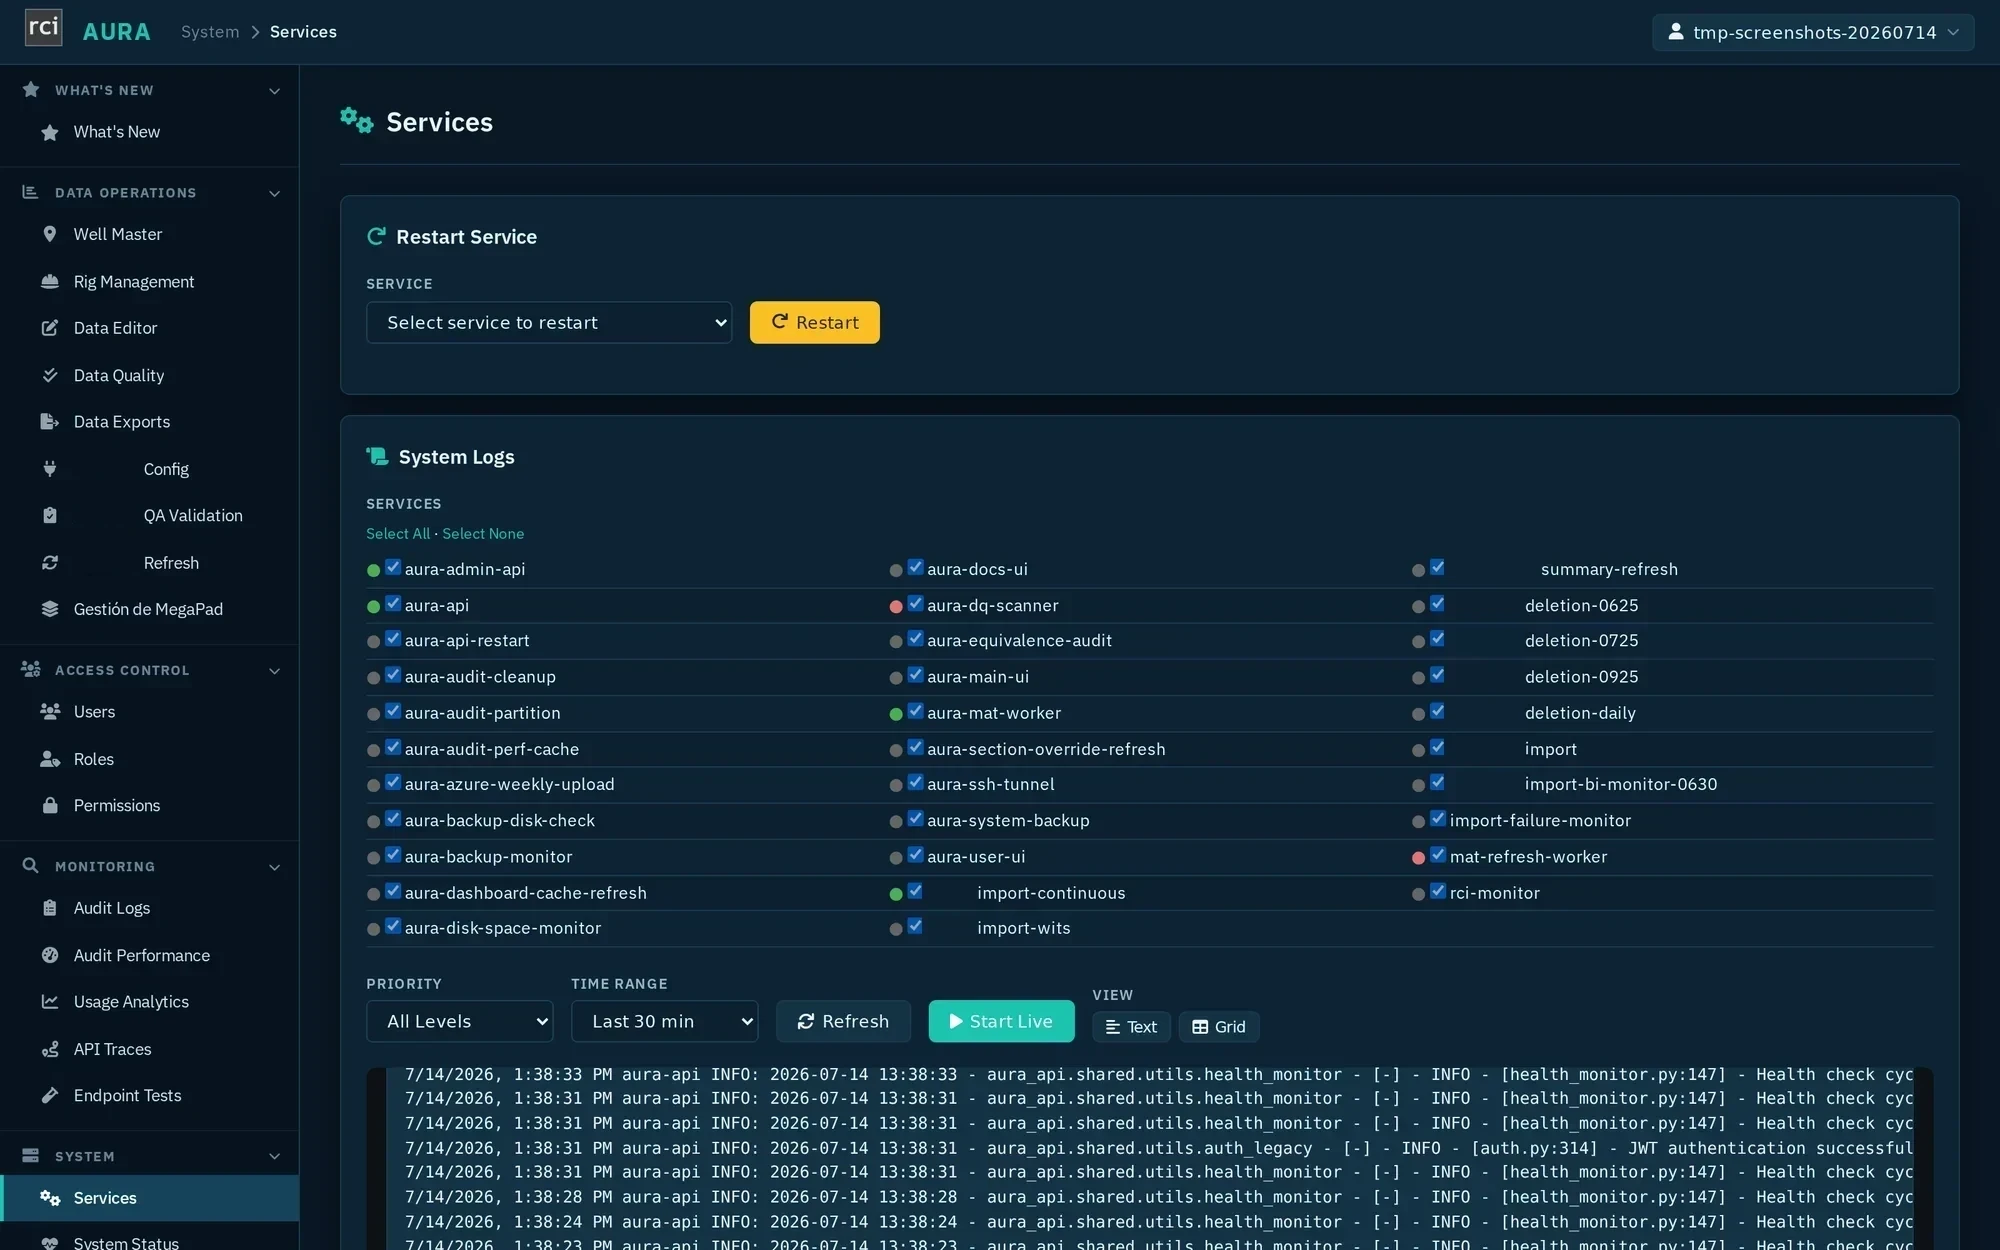
Every automation in this chapter is backed by a live scheduled job on the AURA platform —
not a diagram of an intention. The Services panel shows roughly 35 systemd services with real-time
health, and System Status confirms the integrations themselves are reachable.
Services — live health, not a diagram. Roughly 35 systemd services power every automation in this chapter, each with a live green/red status dot and a tailing log pane underneath.
*Screenshot: AURA Admin portal, Services page, captured 2026-07-14. Integration-specific service names have been generalized; no personal data shown.
On the roadmap: two more automations are queued behind this chapter —
telemetry-driven report pre-fill (auto-populating Operations Reporting System reports from Analytics detections) and
well & event creation in the Corporate ESB directly from AFE triggers — both building on the
automation core shown in this chapter.
06 — Systems & Integrations
12 systems, one platform
AURA doesn't just store data — it's the hub connecting Analytics, Operations Reporting System, Well Data Master, Well File System, FARO,
Themis, TPO, Projects, and more. Click any card to see how data actually moves in and out.
Diagram nodes
External system AURA processing Destination / consumer
Real-Time Drilling & Completions Analytics
Inbound
REST API · daily timer + manual pull
Live
Direction
Inbound — AURA pulls from Analytics
Transport
REST API (/v1/assets, /v1/data, /v1/well-connections)
Trigger / cadence
analytics-import-wits.timer (daily) + manual via analytics_import.py
Analytics asset & WITS import
Assets — pads, wells, rigs, equipment
WITS telemetry — bit depth, hole depth, pump pressure, RPM
Well master — uwi, well_name, pad_name, rig_name, surface location, depths
Pad coordinates — latitude, longitude, ground elevation
Transforms — CSV→COPY binary-safe encoding, UTC normalization; no unit conversion (both systems metric)
Operations Reporting System
Inbound
REST + live SQL · continuous 10–60 min timers
Live
Direction
Inbound — read (REST vistas + live SQL). The AFE→ESB write path reaches Operations Reporting System via Corporate ESB (see AFE→ESB card), not observed by AURA
Transport
REST vistas + live SQL pass-through; SOAP XML for writes
Tracked — API response time, error counts, import lag, DB connection pool, disk space
Backup monitor — hardened threshold (<150GB free OR ≥95% used)
07 — API Endpoints for BI / UTF
34 endpoints, one consistent contract
Built for the consumers that matter: BI dashboards and UTF template exports. Every
endpoint — reporting, completions, drilling, AFE — shares the same auth model, the
same query parameters, the same metadata envelope, and the same four output formats. Learn
the pattern once, integrate any BI tool or script the same way.
34
public endpoints across 4 BI-facing domains
30+
admin endpoints (separate aura_admin_api)
98.6M
records served in the last 30 days — ~100K requests
3
auth methods — JWT, API key, OAuth 2.0
4
output formats — JSON, CSV, XLSX, Parquet
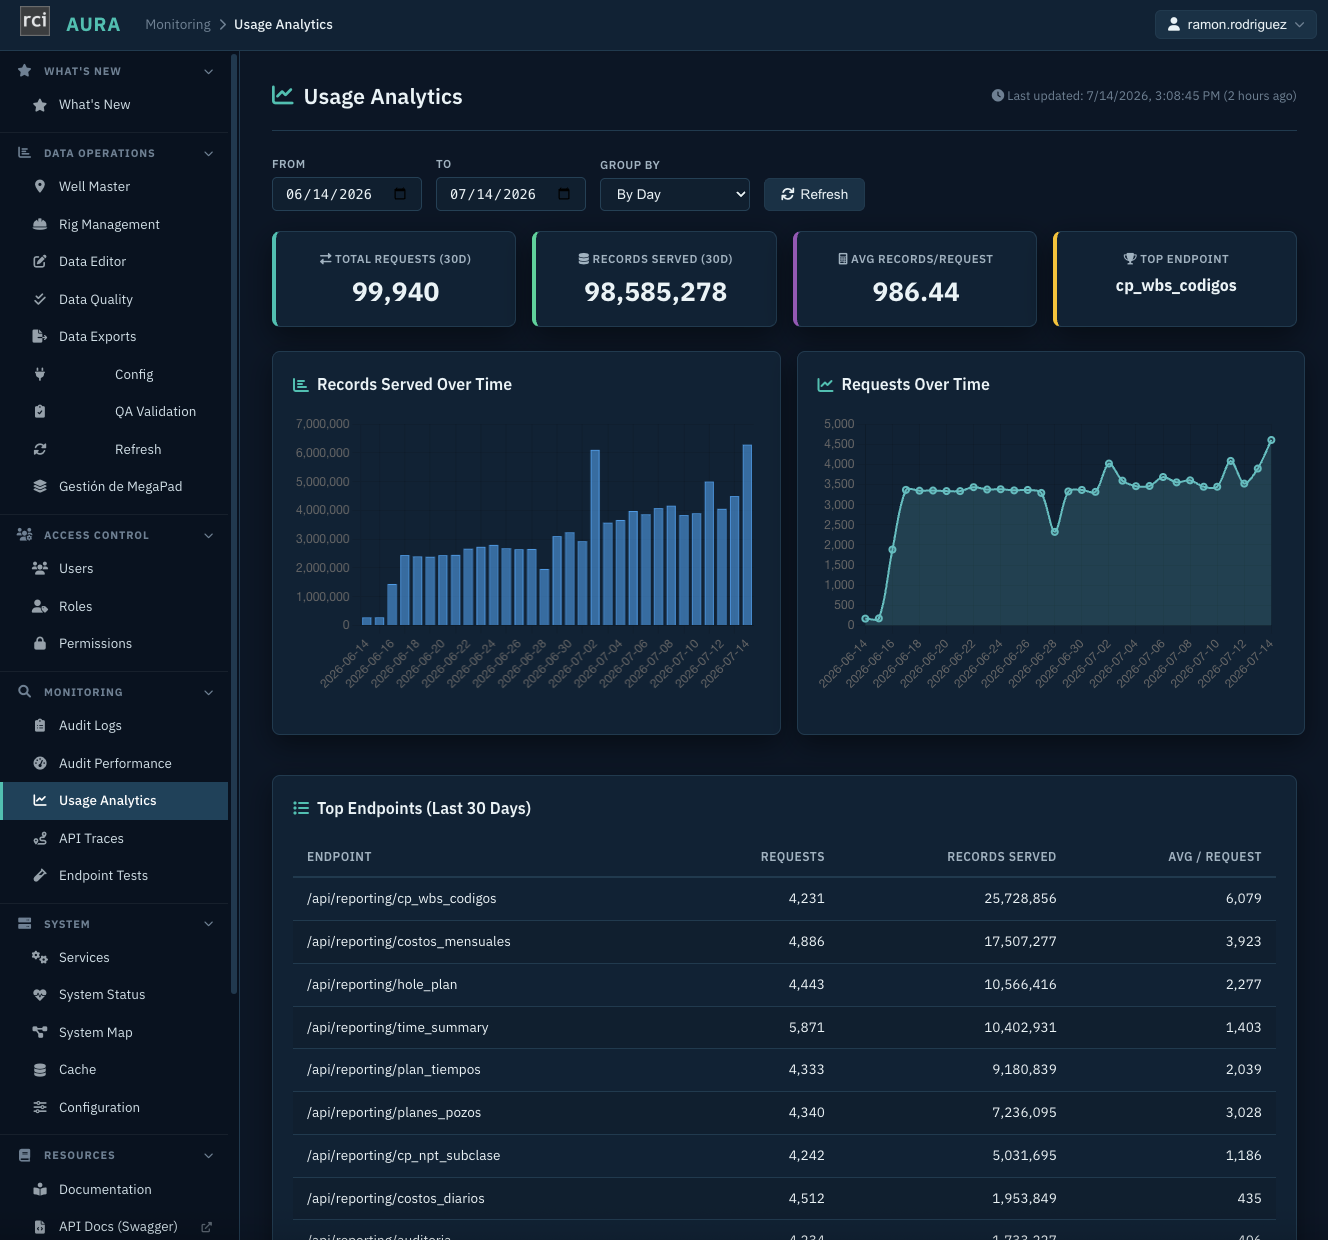
Not just designed for BI — used by it. Live usage analytics: 99,940 API requests served 98.6M records in the last 30 days (≈986 records per request, ≈3,300 requests a day), and the top endpoints are precisely the BI/UTF reporting feeds — cp_wbs_codigos (25.7M records), costos_mensuales (17.5M), hole_plan (10.6M), time_summary (10.4M).
The endpoint surface, by domain
Reporting carries most of the surface area — financial reports, operational timelines, and
well metadata. Completions covers frac/wireline stage tracking and 10-second telemetry.
The remaining domains are narrower, purpose-built endpoints.
Public endpoint count by domain (34 total)
Reporting
22
Analytics Completions
10
AFE
1
Analytics Drilling
1
*Reporting includes costos_mensuales, costos_diarios, eventos, time_summary, datos_generales, planes_pozos and 16 more. Analytics Completions covers stage tracking, frac/wireline milestones, and 10-second telemetry streams. A generic OData endpoint (/api/generic/data) additionally serves ad-hoc queries over any stored data type.
Auth, roles, and formats — one pattern for all 34
Pick the auth method that fits the client, request the format the consumer needs, and
every endpoint responds the same shape.
API keys — persistent, no rotation needed, best for service accounts
OAuth 2.0 — Google/Microsoft, HttpOnly cookies for browser dashboards
Role
Access
Use case
ReadOnly
Read data endpoints only
BI analysts, dashboard viewers
DataManager
Read/write + exports
Data management, ETL workflows
Developer
Admin tools + dev endpoints
API development, integration work
System
Full system access
System administrators
Output formats
JSON default, preserves types
CSV flattened, Excel-ready
XLSX auto-formatted columns
Parquet 5–10x compression, best for BI
Response-time tiers
Aggregated (70–100 rows) <100ms
Detail (200–300 rows) 0.5–1.2s
Historical (2,000+ rows) 1–2s
Large exports (10,000+) 5–15s
Anatomy of a request
One annotated example teaches the whole contract: standard query parameters, the
__aura_* metadata envelope on every record, and a consistent
top-level metadata block.
GET /reporting/costos_mensuales200 OK
# Real request — costos_mensuales, formatted for BI consumption
GET /reporting/costos_mensuales?start_date=2026-03-01&output_format=parquet&field_template=BI
Authorization: Bearer <jwt_or_api_key>
start_date — filters to the operational window (Buenos Aires TZ, minus 6h)
output_format — one of json / csv / xlsx / parquet
field_template — BI (business-friendly names) or raw (database names)
Interactive docs: Every endpoint is browsable and testable at
/api/docs — Swagger UI generated from the OpenAPI 3.0 spec, with
request/response schemas and copy-ready curl commands. 22 API doc pages in
/docs/ cover authentication, parameter conventions, and
domain-specific deep dives.
08 — Data Quality
Quality isn't a phase — it's a process that runs every 5 minutes
AURA ships with a testing and monitoring framework sized to match its data surface: 1,626
unit tests gate every commit, a smoke suite gates every deploy, a 3,500-test combinatorial
sweep runs daily against every endpoint, and continuous monitors watch imports, locks, and
health around the clock.
1,626
pytest unit tests across 102 files (600-test CI floor)
Fast checks run on every commit; slower, wider checks run less often but cover more ground.
Together they read as a single sentence: every commit, every deploy, every day, every five
minutes.
Test & monitoring cadence bands
Every commit1,626 unit tests · 600-test CI floor
Lint → Syntax → Security → What's New → Unit tests → DB Grants
Every deploy70-test smoke gate · 2–4 min
2 combos × 34 endpoints
Every day3,500-combination full sweep · 07:00 UTC · FARO-notified
That continuous layer runs at two levels: inside AURA (import-lag, database-lock
contention, endpoint health, and data-quality scans, all reporting to FARO) and
outside it, where the RCI Monitor platform watches the host itself —
services, disk, memory, load, and SSL expiry. A failed sync and a failing server both page the
team before users notice either one.
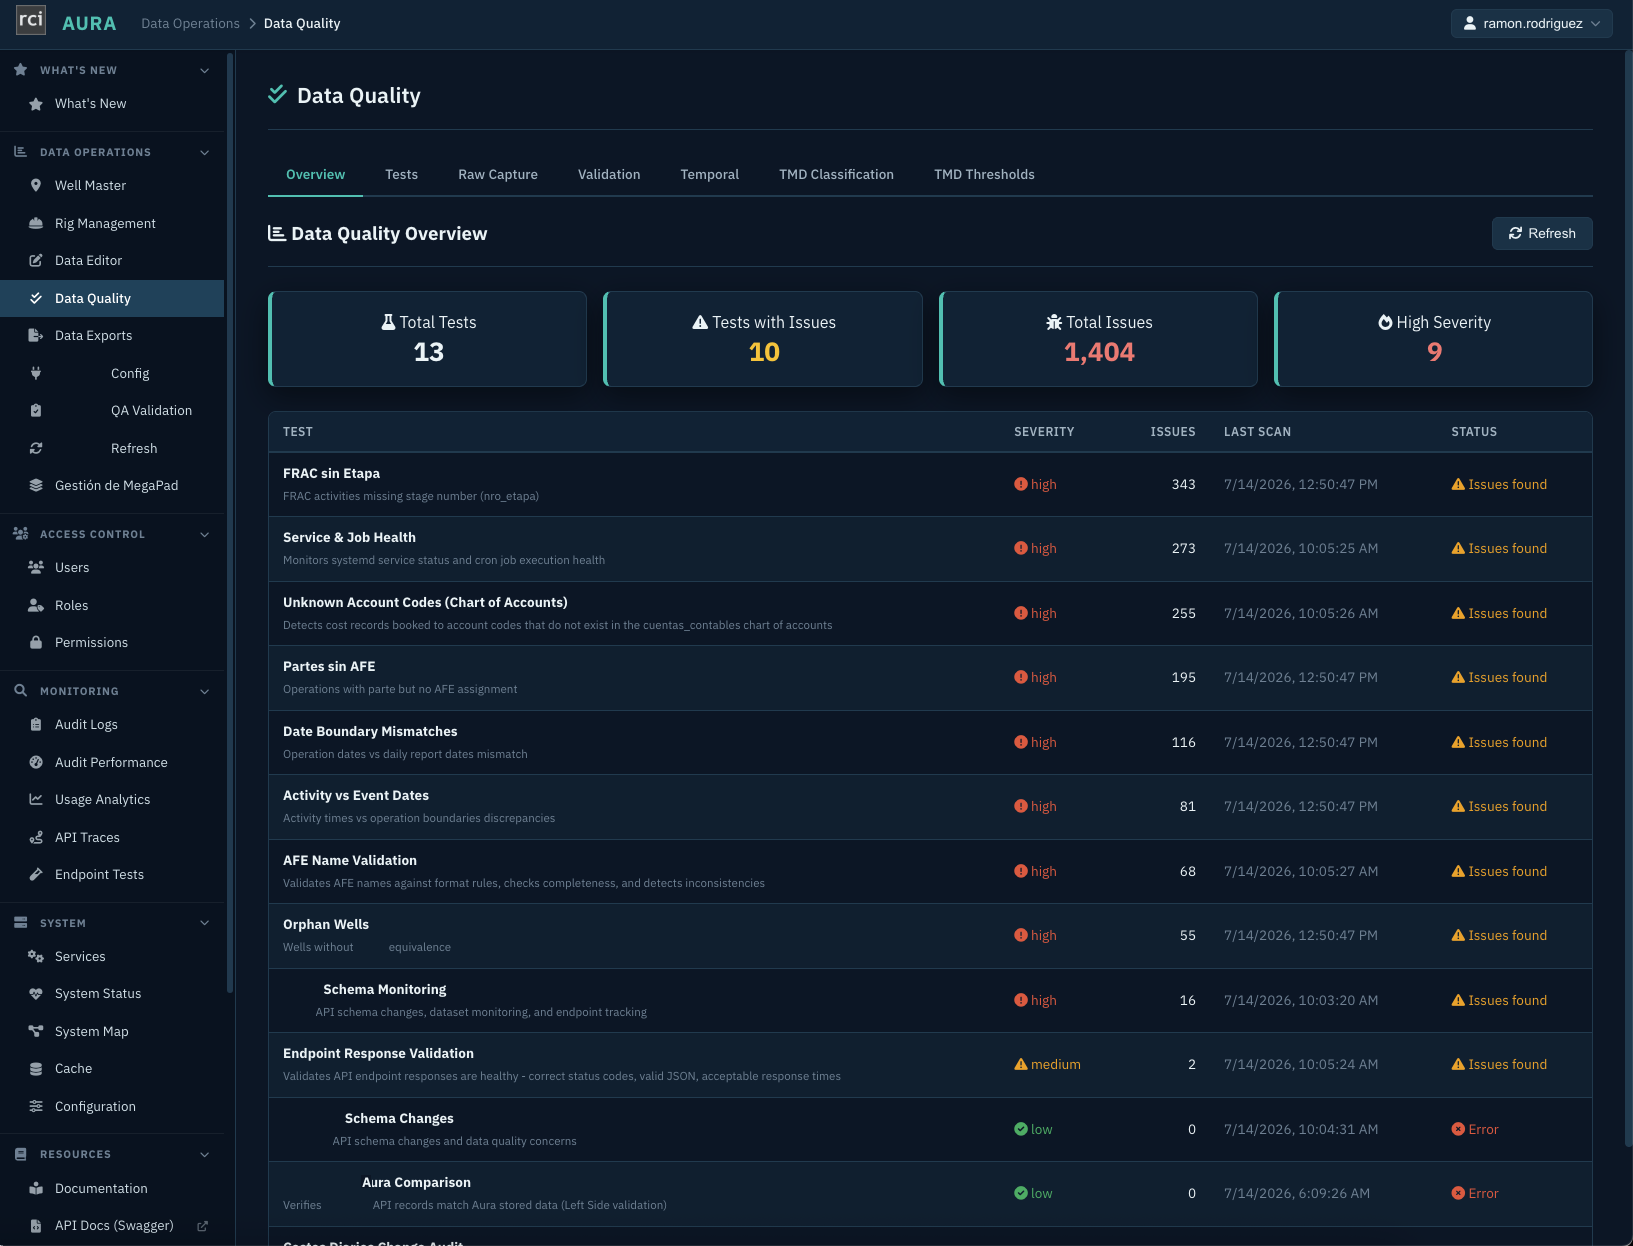
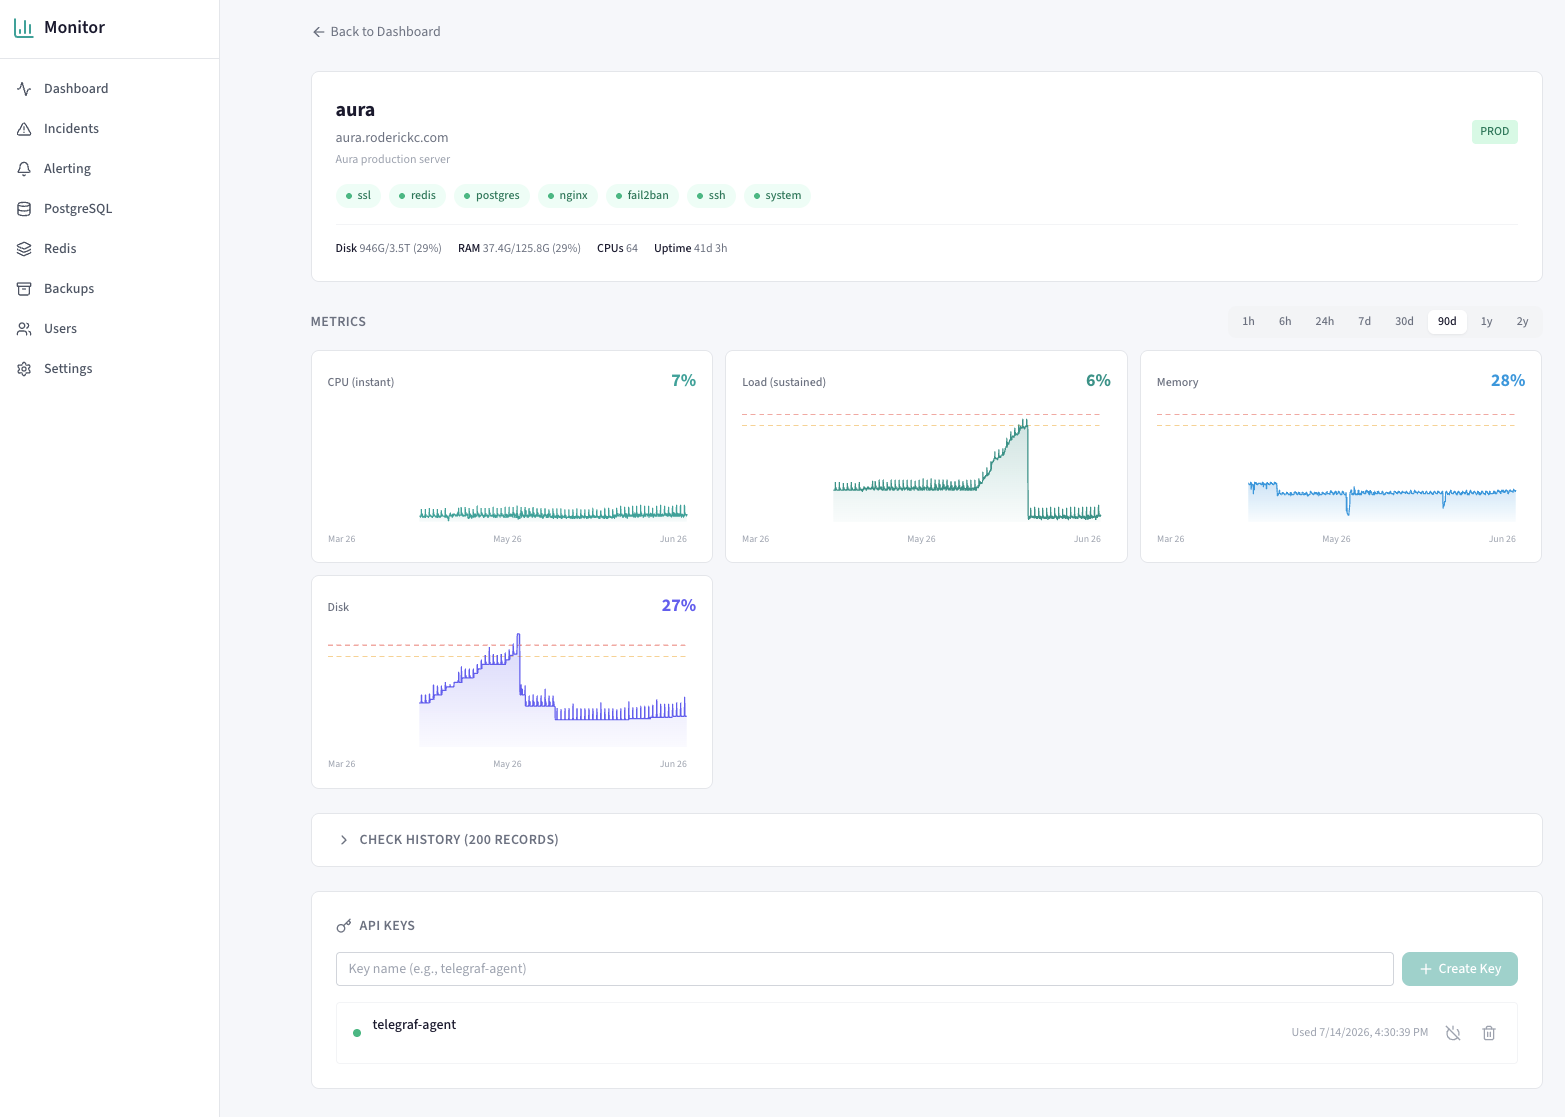
Inside: 13 automated checks, running now. These are business-rule tests — a frac stage without a stage number, an operation without an AFE, a cost booked to a nonexistent account — not just technical checks, scanned continuously with severity and history. Issue counts demonstrate the checks are actually running against production data, not a claim that the data has a problem.Outside: the host, watched independently. RCI Monitor tracks the AURA server itself — seven service checks, 90-day resource trends with alert thresholds, and a live agent — so infrastructure failures surface even if AURA's own monitors can't report them.
The CI/CD gate pipeline
Every push and pull request runs the same sequence of gates, in order — all must pass before merge.
ci.yml — gate sequence
1 Lint
→
2 Syntax
→
3 Security
→
4 What's New
→
5 Unit floor (600)
→
6 DB Grants
→
7 Integration
Proof point: the __aura_external_id audit
Every BI consumer merges on __aura_external_id — it has to be
an integer, unique per row, and stable across reloads. In July 2026, three reporting
endpoints needed surrogate-key fixes; all 34 reporting and completions endpoints are now
audited and verified distinct count == row count.
Security posture: Redis-based rate limiting, environment-specific CORS
allowlist (no wildcard), HSTS on all HTTPS endpoints, obfuscated server header, and secret
scanning built into every CI run.
09 — Data Governance
The data is governed, not just stored.
Governance in AURA is three disciplines working together: authoritative masters, enforced
safeguards, and a complete audit trail — so the data can be trusted independent of
whichever technology happens to move it.
A · Masters — one authoritative source per entity
Every governed entity has exactly one system of record. AURA doesn't compete with that
authority — it observes it, mirrors it faithfully, and gives operators a single place
to manage the master data everything else depends on.
Well Master
Well Data Master is authoritative. AURA maintains a strict 1:1 POZO_ID ↔ UWI mapping, synced across 6,575 wells with zero inactivations from the sync process — AURA observes, it doesn't overwrite.
Well Master · Rig Management
Rig Master
Rig identity and specs are curated the same way as wells — one editable master record per rig, referenced everywhere a rig is mentioned across drilling, completions, and cost data.
Rig Management
Catalogs & identity
Event catalogs, account codes, and every other lookup table are governed through the same Data Editor as production data. Identity is stable: __aura_external_id gives every record a deterministic business key (see Chapter 04).
Data Editor
*Source: platform automation documentation, Use Case 1 (Well Data Master read → create well, D1): 6,575 active wells, strict 1:1 POZO_ID↔UWI match, 0 inactivations confirmed. Cross-ref Chapter 04 for __aura_external_id.
B · Safeguards — the data protects itself
Where AURA is not the system of record, it writes back carefully — guarded, staged, and
reversible — and where a field is sensitive, access can be locked down to that single
field without touching anything else on the record.
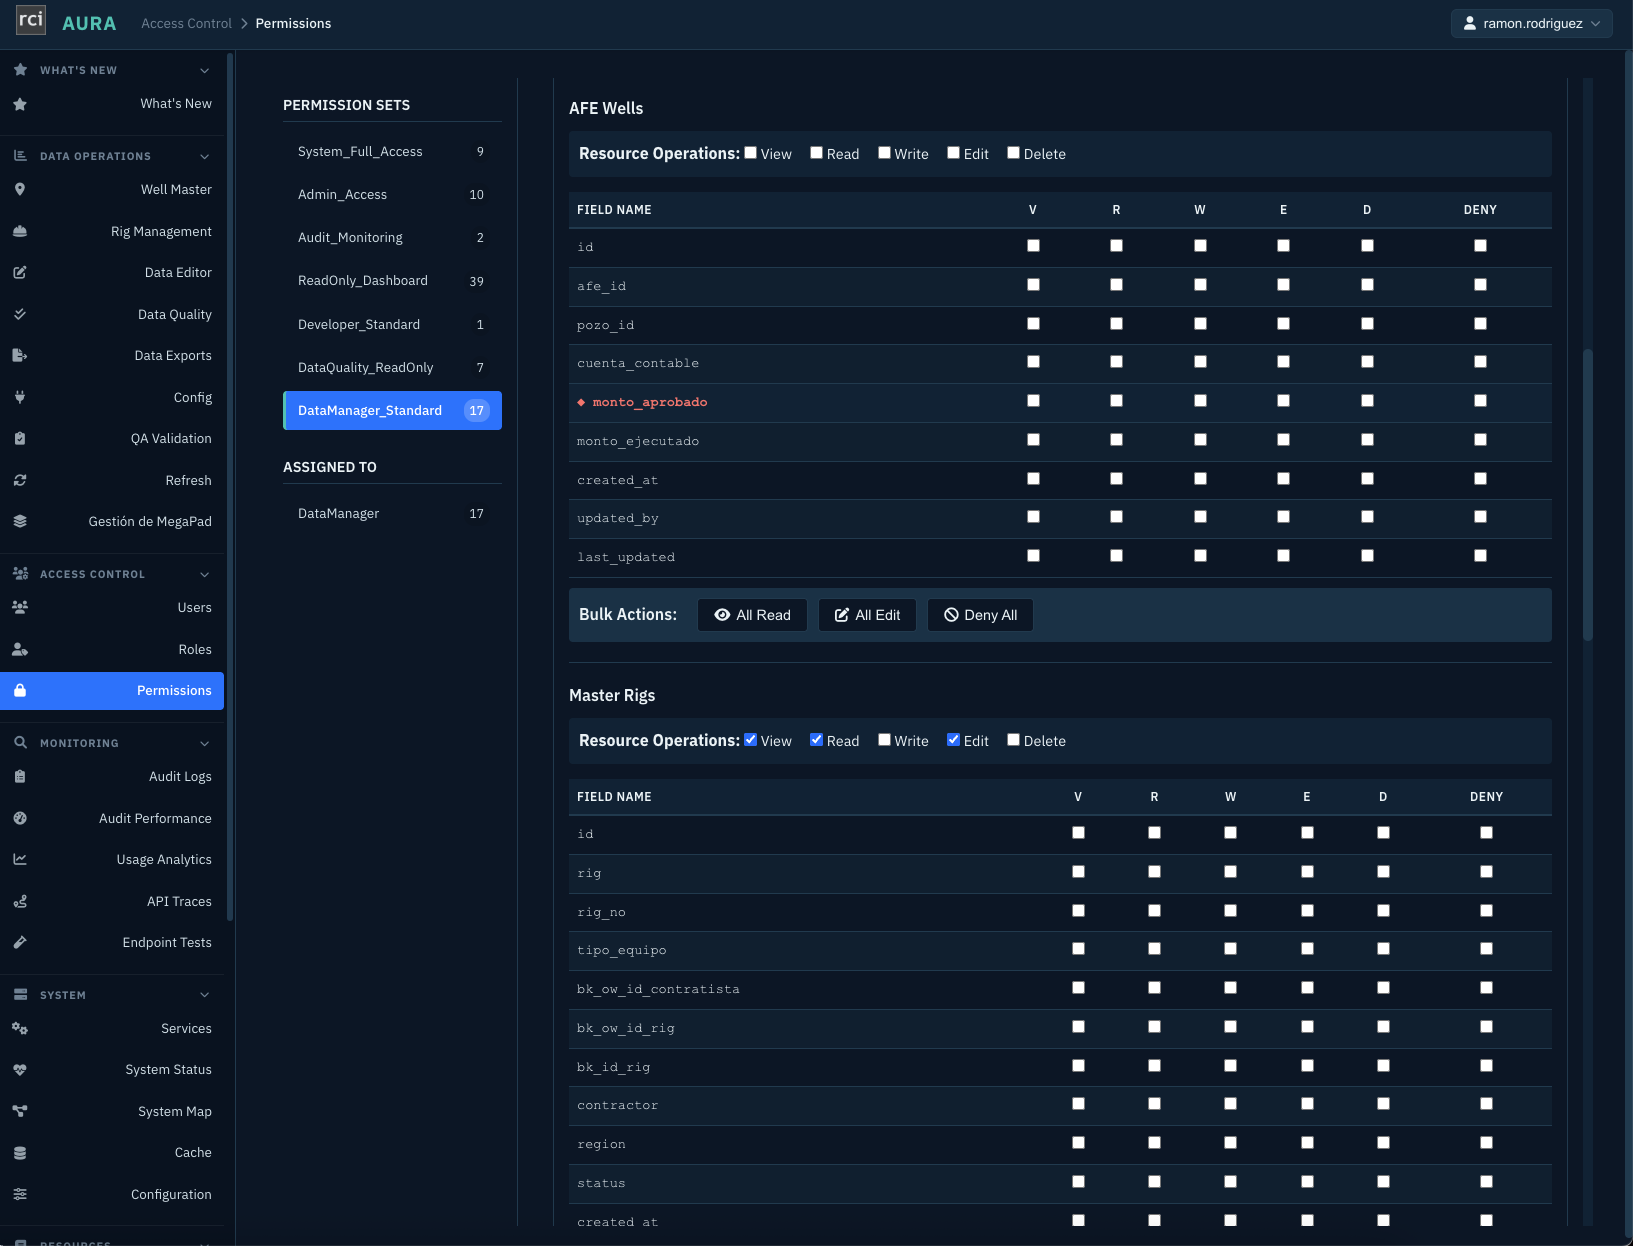
Governance down to the field. Seven named permission sets control access at both the resource level and the individual field level. Here monto_aprobado (approved amount) is locked on AFE Wells — a data manager can edit the rest of the record, but that field stays closed. Deny always overrides a grant.
Write-back discipline
The one place AURA writes into another system's master data — Well Data Master's operation
dates and survey depths — is guarded on every side:
No-downgrade guard: a shallower or older value never overwrites a better existing one (50m tolerance on depth checks)
Idempotent push ledger: every write is tracked; unchanged values are never re-sent
Dry-run first: every write path is validated in simulation before a single real value moves
Explicit sign-off gates: live writes wait on named approval before they activate
Read-only where AURA isn't the owner. Well Operations Archive is read-only on QA/PROD.
Well Data Master's well master sync (D1) is observe-only — AURA never writes back into the well
master itself, only into six specific operation-date and depth attributes, under all four
guards above.
The Ledger, again: nothing in aura_data is overwritten or
physically deleted. A status lifecycle (active → superseded/deleted) plus
dual timestamps (source last_updated and AURA's own internal_last_updated)
make every value replayable “as of” any moment — see Chapter 04 for the full
mechanism and a live audit example.
*Source: platform automation documentation, Use Case 2 (operation-date writeback, D2): no-downgrade guard, idempotent push ledger, staged rollout gates. See Chapter 04 for the Ledger mechanism.
C · Audit — who did what, when
Every request is logged, every field-level change has history through the Ledger, and three
dedicated admin views turn that raw log into something an operator can actually use.
769K
audit events logged in the last 7 days
100%
of API calls logged — every request, not a sample
∞
field-level change history via the Ledger — never pruned
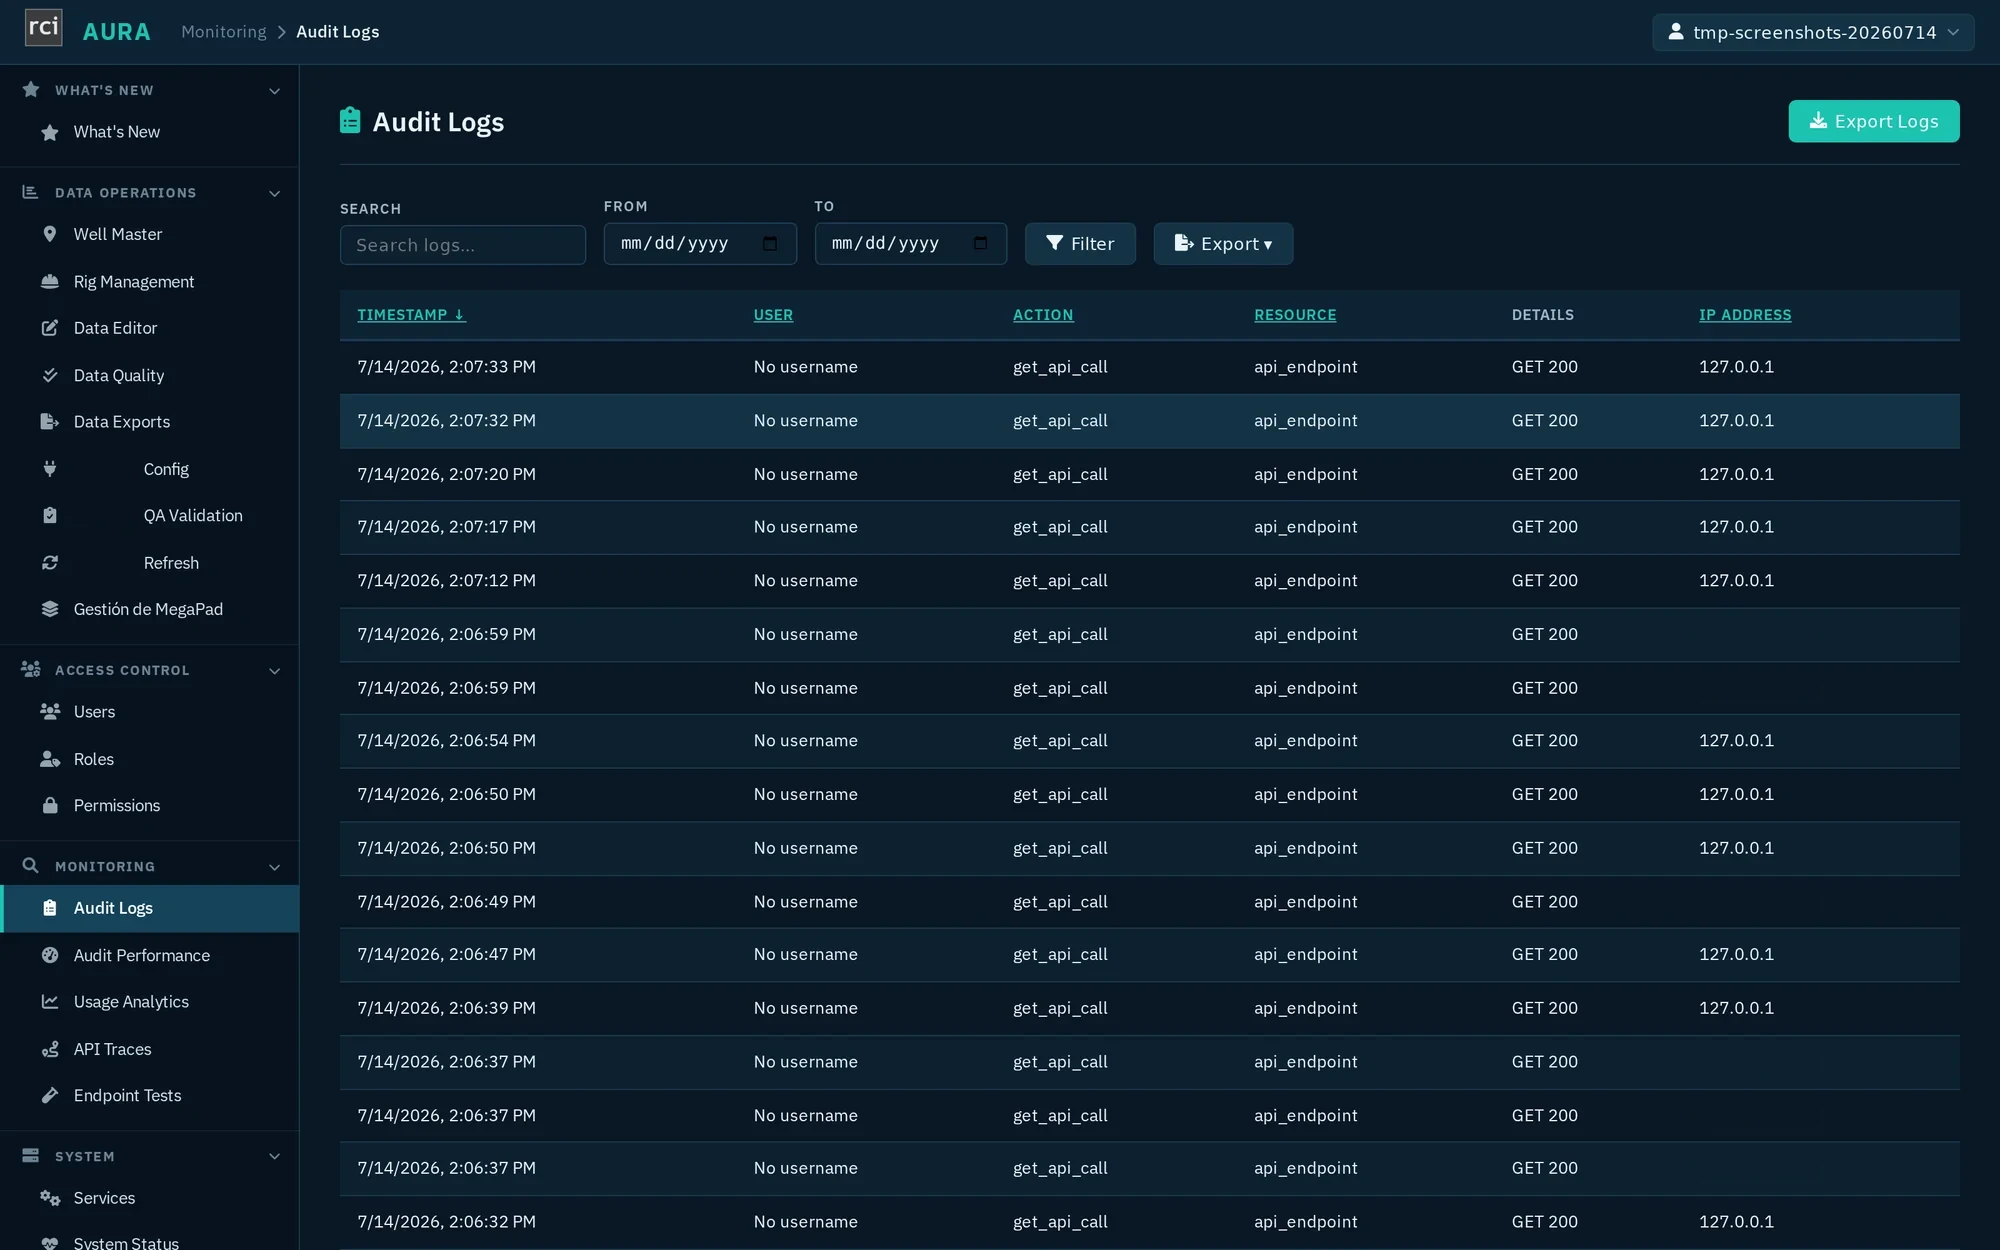
Every request, one searchable log. Timestamp, user, action, resource, and source IP on every call — searchable, filterable by date range, and exportable. API-key and unauthenticated calls show as “No username” rows rather than a gap in the record.
Three more admin views turn that raw log into governance: Audit Performance
tracks the audit system's own health, Usage Analytics shows who is calling
which endpoints (Chapter 07 covers the volume side — 99,940 requests and 98.6M records
served in 30 days), and API Traces gives a request-by-request drill-down when
something needs investigating.
*Source: audit event count and admin navigation from the Chapter 02 dashboard capture; audit log screenshot captured 2026-07-14. Usage figures cross-referenced from Chapter 07.
10 — The Value
Why operators choose AURA
Everything in this presentation is running in production today, over 280M+ records at a major
energy operator. This is what that buys — and how to see it against your own wells.
What an operator gets
Unify
One source of truth
Five source systems, one governed PostgreSQL model, one 95+ endpoint REST API. BI tools, engineers, and integrations stop reconciling and start querying.
Speed
New sources in hours, not projects
The flexible-storage registry turns a new data source into configuration, not code — a new vista can be live and serving BI reports in under an hour.
Automate
One trigger, many systems
An AFE created upstream reaches the ESB, daily reporting, completions staging, and the right inboxes in minutes — work that used to mean days of manual re-entry.
Trust
Data quality that watches itself
Business-rule tests, schema-drift alerts, and a ledger keeping full history on every record. Every failure reaches a human inbox automatically.
Govern
Governance built in
Corporate SSO, role-based access down to the individual field, and a fully audited admin surface — who saw what, who changed what, always answerable.
Deploy
Runs where you need it
Fully managed today, with a proven migration path onto an operator's own cloud infrastructure. No re-platforming, no lock-in surprise.
The numbers behind the claims
280M+
records under management in production
<1 hr
to onboard a new data source, config-only
99.9%
uptime SLA in production
100%
of admin actions audited, searchable, exportable
See it against your own wells
The fastest way to evaluate AURA is a walkthrough with your data in the loop —
your source systems, your naming, your reporting pain. We will show you the path from
scattered systems to one governed platform.